


Material Flow
Material flow analysis (MFA) is a quantitative method to determine the flow of materials and energy through an economy. It works by capturing the mass balance in an economy, where extraction and imports are considered inputs and consumption and exports as outputs. The mass balance of inputs should be equal to outputs, which is useful in determining the efficiency of the use of material resources.
From the perspective of waste in general, MFA is required to develop a standard tool of waste statistics between countries. However, for plastic waste thiscan be difficult to implement because many plastic materials, such as polyethylene and polypropylene, are used for many different products (Moriguchi and Hashimoto, 2016).
MFA of Plastics in Thailand
Bureecaam, Chaisomphob, and Sungsomboon (2018) demonstrate the MFA for plastic waste and plastic waste management in Thailand. They use primary and secondary sources to obtain the data from 11 provinces.
Figure 1. MFA of Plastic in Thailand in 2013
(Source: Bureecaam et al., 2018).
Figure 1 shows petrochemical industries in Thailand produced 7,827,481 tonnes of raw materials in 2013, around 1,101,329 tonnes of which were derived from recycled materials. After 2,732,675 tonnes was consumed, 3,560,595 tonnes of plastic waste was generated. Some of the plastic waste was then collected and disposed of by the local government, while 499,295 tonnes remained uncollected. The collected waste went to different treatment facilities, 765,883 tonnes of which was recycled while 220,949 tonnes was incinerated to generate energy. The remaining 1,986,648 tonnes was disposed of to a landfill site. Unfortunately, 597,115 tonnes of plastic waste was improperly managed in the collection and transportation process. The waste was then mixed with the uncollected waste in the previous process, resulting in 1,076,410 tonnes ending up in the open environment, which potentially leaked into the oceans.
The Philippines
MFA for plastic scraps in the Philippines is shown in Figure 2.
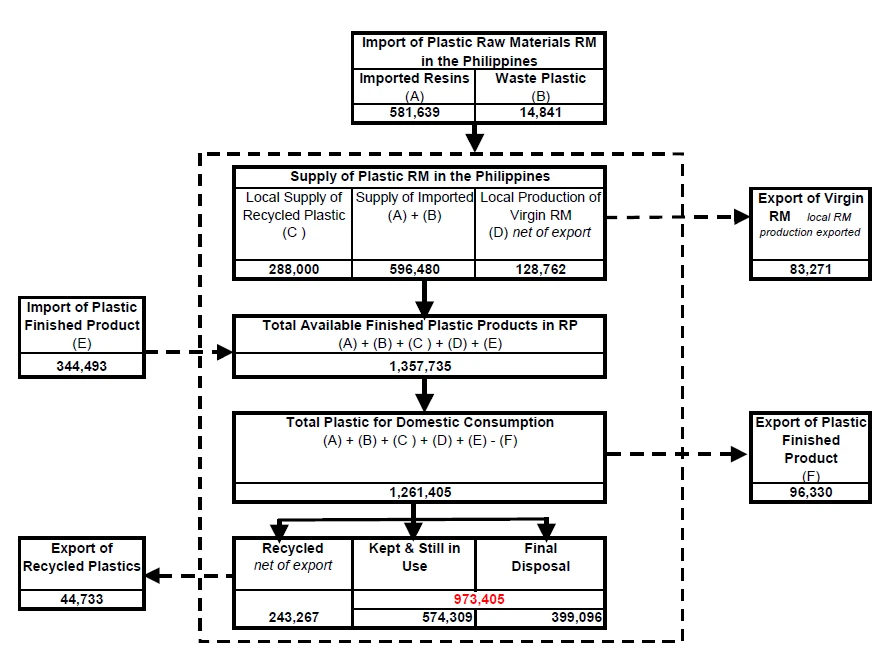
Figure 2. MFA of Plastic Scraps in the Philippines (Source: Japan International Cooperation Agency, 2008).
The Philippines produces 1,013,242 tonnes of plastic per year derived from three sources: imported resins (581,639 tonnes/year) and imported plastic waste (14,841 tonnes/year), local supply of recycled plastic (288,000 tonnes/year), and from local production of virgin raw materials (128,762 tonnes/year). The total number of plastic products is then calculated by adding total plastic production and imports of plastic finished products (344,493 tonnes/year) or 1,357,735 tonnes/year. To obtain the total local consumption, this number is deducted from the number of exported plastic finished products (96,330 tonnes/year), for a total of 1,261,405 tonnes/year.
Local plastic consumption is processed in several phases: recycled, kept (still being used), and disposed of to a landfill. Recycled plastic accounts for 243,267 tonnes/year. Those still being used and those disposed of to a landfill account for 574,309 tonnes/year and 399,096 tonnes/year, respectively (Japan International Cooperation Agency, 2008). Unfortunately, the study of MFA in the Philippines does not calculate the amount of unmanaged plastic waste that ends up in the open environment and could leak into oceans.
Malaysia
Malaysia’s plastic inventory was calculated based on a survey study which showed local production of 587,062 tonnes of plastic products which, added to the 170,248 tonnes of imported plastic products, totalled 733,828 tonnes of plastic products. Local consumption of plastics was 511,697 tonnes, whilst exports were 222,131 tonnes. Of local plastic consumption, 47,843 tonnes was recycled and the rest (463,854 tonnes) went to final disposal. This study does not cover the amount of plastic waste that ended up in the open environment. Details of MFA plastics in Malaysia are shown in Figure 3.
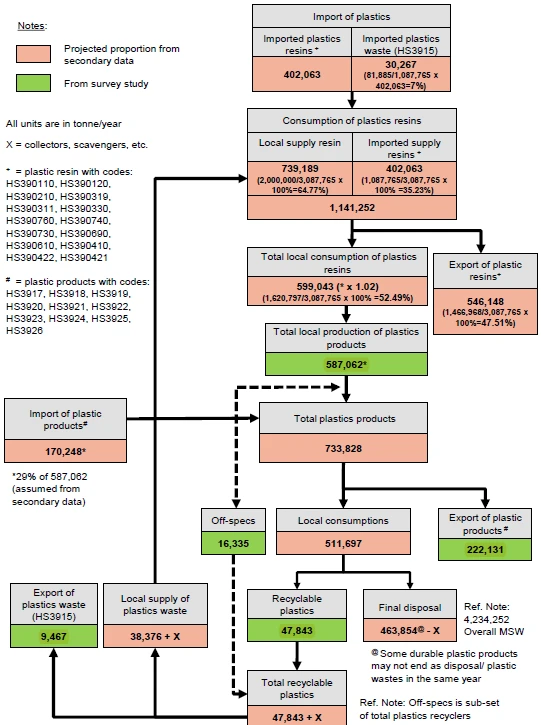
Figure 3. MFA of Plastics in Malaysia (Source: National Solid Waste Management Department Ministry of Housing and Local Government, 2011).
Viet Nam
Plastic material in Viet Nam are derived from two sources: domestic resin (1,000 Ktonnes) and imported resin (5,900 Ktonnes). Plastic (semi) products are used for export and domestic purposes. Exports of plastic (semi) products stood at 3,803 Ktonnes, whilst plastic (semi) products for domestic purposes were 3,690 Ktonnes. Domestic use of the products was by consumers such as the food processing, beverage, textile, and electronics industries; and by end-users such as households, markets, hospitals, and schools. Unfortunately, the process generated 730 Ktonnes of uncollected plastic waste that was disposed of into the oceans. The 2,815–3,115 Ktonnes of remaining plastic waste was collected and transported to the next process. Some 807 Ktonnes of resin was exported, while the remaining waste and scraps were recycled. The waste generated from recycling, collection, and transportation was eventually disposed of in landfills – 1,308 Ktonnes of waste went to landfills.
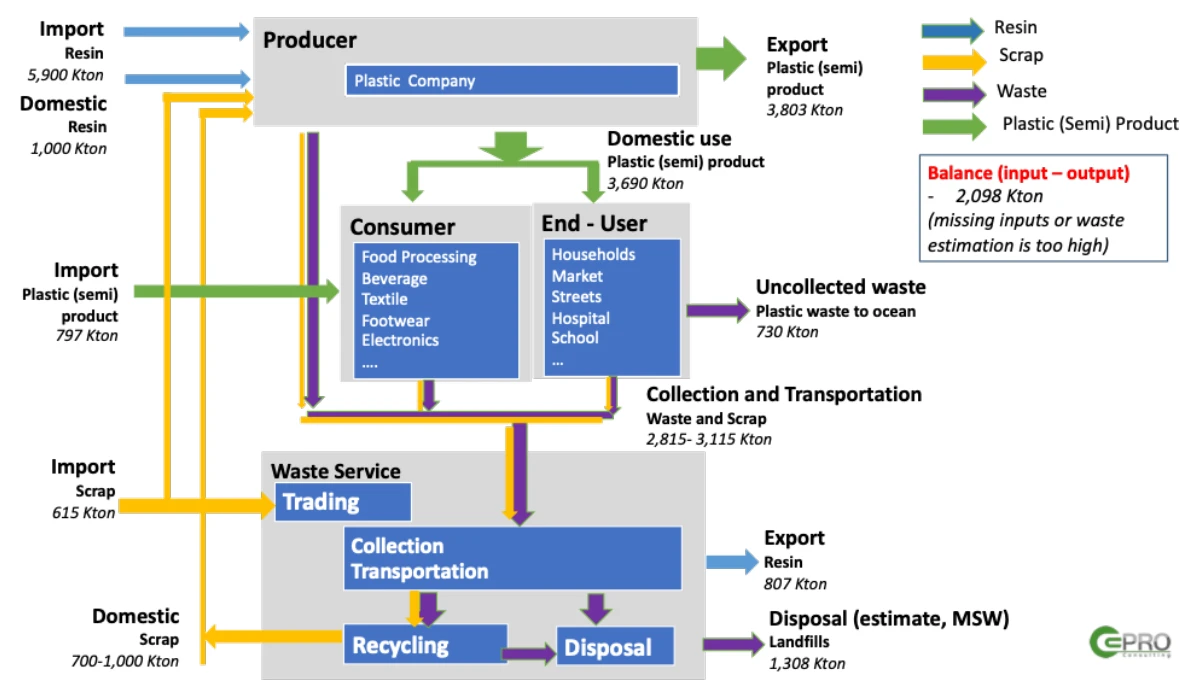
Figure 4. MFA of Plastics in Viet Nam (Vietnam Business Council for Sustainable Development and United States Business Council for Sustainable Development, 2019).
In summary, some plastic waste continues to be uncollected or improperly managed, when looking at the MFA of plastic-related products in Southeast Asian countries, thus ending up in the open environment and oceans, as in the Philippines and Viet Nam. In general, countries in this region have huge amounts of plastic waste going to landfills instead of being recycled or used to generate energy. Uncontrolled landfills can lead to the leakage of plastic waste into oceans.
C Bureecam, T Chaisomphob, and P Sungsomboon (2018), ‘Material Flows Analysis of Plastic in Thailand’, Thermal Science, 22(6 Part A), 2379–2388. https://www.researchgate.net/profile/Chira-Bureecam-2/publication/313283083_Material_flows_analysis_of_plastic_in_Thailand/links/589d2a6292851c599c975812/Material-flows-analysis-of-plastic-in-Thailand.pdf (accessed 1 September 2021).
Japan International Cooperation Agency (2008), The Study on Recycling Industry Development in the Republic of the Philippines Final Report. https://openjicareport.jica.go.jp/pdf/11882396.pdf (accessed 1 September 2021).
Y Moriguchi, and S Hashimoto(2016), ‘Material Flow Analysis and Waste Management’ in R Clift, and A Druckman (eds), Taking Stock of Industrial Ecology. Springer, Cham pp 247–262. https://doi.org/10.1007/978-3-319-20571-7_12 (accessed 1 September 2021).
National Solid Waste Management Department-Ministry of Housing and Local Government Malaysia (2011), A Study on Plastic Management in Peninsular Malaysia. https://jpspn.kpkt.gov.my/resources/index/user_1/Sumber_Rujukan/kajian/JPSPN%20Plastic%20Study%20-%20Final%20Report%20GESB%20-%20Softcopy%20English%20Ed2.pdf (accessed 1 September 2021).
S Pincetl, (2012), ‘A Living City: Using Urban Metabolism Analysis to View Cities as Life Forms’, in F Zeman (ed), Metropolitan Sustainability. Woodhead Publishing, Cham pp 3–25. https://doi.org/10.1533/9780857096463.1.3 (accessed 1 September 2021).
Viet Nam Business Council for Sustainable Development and United States Business Council for Sustainable Development (2019), Viet Nam Materials Marketplace. https://p4gpartnerships.org/sites/default/files/2019-07/materials%20marketplace%20final%20report.pdf (accessed 1 September 2021).